Quantcast
Channel: V8 JavaScript Engine
Viewing all 74 articles
Browse latest View live

Lazy deserialization

$
0
0

TL;DR: Lazy deserialization was recently enabled by default in V8 version 6.4, reducing V8’s memory consumption by over 500 KB per browser tab on average. Read on to find out more!

Introducing V8 snapshots

But first, let’s take a step back and have a look at how V8 uses heap snapshots to speed up creation of new Isolates (which roughly correspond to a browser tab in Chrome). My colleague Yang Guo gave a good introduction on that front in his article on custom startup snapshots:

The JavaScript specification includes a lot of built-in functionality, from math functions to a full-featured regular expression engine. Every newly-created V8 context has these functions available from the start. For this to work, the global object (for example, the window object in a browser) and all the built-in functionality must be set up and initialized into V8’s heap at the time the context is created. It takes quite some time to do this from scratch.

Fortunately, V8 uses a shortcut to speed things up: just like thawing a frozen pizza for a quick dinner, we deserialize a previously-prepared snapshot directly into the heap to get an initialized context. On a regular desktop computer, this can bring the time to create a context from 40 ms down to less than 2 ms. On an average mobile phone, this could mean a difference between 270 ms and 10 ms.

To recap: snapshots are critical for startup performance, and they are deserialized to create the initial state of V8’s heap for each Isolate. The size of the snapshot thus determines the minimum size of the V8 heap, and larger snapshots translate directly into higher memory consumption for each Isolate.

A snapshot contains everything needed to fully initialize a new Isolate, including language constants (e.g., the undefined value), internal bytecode handlers used by the interpreter, built-in objects (e.g., String), and the functions installed on built-in objects (e.g., String.prototype.replace) together with their executable Code objects.

Startup snapshot size in bytes from 2016-01 to 2017-09. The x-axis shows V8 revision numbers.

Over the past two years, the snapshot has nearly tripled in size, going from roughly 600 KB in early 2016 to over 1500 KB today. The vast majority of this increase comes from serialized Code objects, which have both increased in count (e.g., through recent additions to the JavaScript language as the language specification evolves and grows); and in size (built-ins generated by the new CodeStubAssembler pipeline ship as native code vs. the more compact bytecode or minimized JS formats).

This is bad news, since we’d like to keep memory consumption as low as possible.

Lazy deserialization

One of the major pain points was that we used to copy the entire content of the snapshot into each Isolate. Doing so was especially wasteful for built-in functions, which were all loaded unconditionally but may never have ended up being used.

This is where lazy deserialization comes in. The concept is quite simple: what if we were to only deserialize built-in functions just before they were called?

A quick investigation of some of the most popular websites showed this approach to be quite attractive: on average, only 30% of all built-in functions were used, with some sites only using 16%. This looked remarkably promising, given that most of these sites are heavy JS users and these numbers can thus be seen as a (fuzzy) lower bound of potential memory savings for the web in general.

As we began working on this direction, it turned out that lazy deserialization integrated very well with V8’s architecture and there were only a few, mostly non-invasive design changes necessary to get up and running:

  1. Well-known positions within the snapshot. Prior to lazy deserialization, the order of objects within the serialized snapshot was irrelevant since we’d only ever deserialize the entire heap at once. Lazy deserialization must be able to deserialize any given built-in function on its own, and therefore has to know where it is located within the snapshot.
  2. Deserialization of single objects. V8’s snapshots were initially designed for full heap deserialization, and bolting on support for single-object deserialization required dealing with a few quirks such as non-contiguous snapshot layout (serialized data for one object could be interspersed with data for other objects) and so-called backreferences (which can directly reference objects previously deserialized within the current run).
  3. The lazy deserialization mechanism itself. At runtime, the lazy deserialization handler must be able to a) determine which code object to deserialize, b) perform the actual deserialization, and c) attach the serialized code object to all relevant functions.

Our solution to the first two points was to add a new dedicated built-ins area to the snapshot, which may only contain serialized code objects. Serialization occurs in a well-defined order and the starting offset of each Code object is kept in a dedicated section within the built-ins snapshot area. Both back-references and interspersed object data are disallowed.

Lazy built-in deserialization is handled by the aptly named DeserializeLazy built-in, which is installed on all lazy built-in functions at deserialization time. When called at runtime, it deserializes the relevant Code object and finally installs it on both the JSFunction (representing the function object) and the SharedFunctionInfo (shared between functions created from the same function literal). Each built-in function is deserialized at most once.

In addition to built-in functions, we have also implemented lazy deserialization for bytecode handlers. Bytecode handlers are code objects that contain the logic to execute each bytecode within V8’s Ignition interpreter. Unlike built-ins, they neither have an attached JSFunction nor a SharedFunctionInfo. Instead, their code objects are stored directly in the dispatch table into which the interpreter indexes when dispatching to the next bytecode handler. Lazy deserialization is similar as to built-ins: the DeserializeLazy handler determines which handler to deserialize by inspecting the bytecode array, deserializes the code object, and finally stores the deserialized handler in the dispatch table. Again, each handler is deserialized at most once.

Results

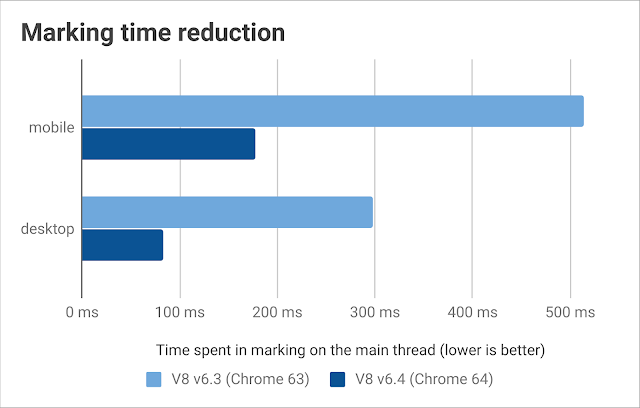
We evaluated memory savings by loading the top 1000 most popular websites using Chrome 65 on an Android device, with and without lazy deserialization.

On average, V8’s heap size decreased by 540 KB, with 25% of the tested sites saving more than 620 KB, 50% saving more than 540 KB, and 75% saving more than 420 KB.

Runtime performance (measured on standard JS benchmarks such as Speedometer, as well as a wide selection of popular websites) has remained unaffected by lazy deserialization.

Next steps

Lazy deserialization ensures that each Isolate only loads the built-in code objects that are actually used. That is already a big win, but we believe it is possible to go one step further and reduce the (built-in-related) cost of each Isolate to effectively zero.

We hope to bring you updates on this front later this year. Stay tuned!

Posted by Jakob Gruber (@schuay)


Tracing from JS to the DOM and back again

$
0
0

Summary

Debugging memory leaks in Chrome 66 just became much easier. Chrome’s DevTools can now trace and snapshot C++ DOM objects and display all reachable DOM objects from JavaScript with their references. This feature is one of the benefits of the new C++ tracing mechanism of the V8 garbage collector.

Background

A memory leak in a garbage collection system occurs when an unused object is not freed due to unintentional references from other objects. Memory leaks in web pages often involve interaction between JavaScript objects and DOM elements.

The following toy example shows a memory leak that happens when a programmer forgets to unregister an event listener. None of the objects referenced by the event listener can be garbage collected. In particular, the iframe window leaks together with the event listener.

// Main window:
const iframe = document.createElement('iframe');
iframe.src = 'iframe.html';
document.body.appendChild(iframe);
iframe.addEventListener('load', function() {
const local_variable = iframe.contentWindow;
functionleakingListener() {
// Do something with `local_variable`.
if (local_variable) {}
}
document.body.addEventListener('my-debug-event', leakingListener);
document.body.removeChild(iframe);
// BUG: forgot to unregister `leakingListener`.
});

The leaking iframe window also keeps all its JavaScript objects alive.

// iframe.html:
classLeak{};
window.global_variable = new Leak();

It is important to understand the notion of retaining paths to find the root cause of a memory leak. A retaining path is a chain of objects that prevents garbage collection of the leaking object. The chain starts at a root object such as the global object of the main window. The chain ends at the leaking object. Each intermediate object in the chain has a direct reference to the next object in the chain. For example, the retaining path of the Leak object in the iframe looks as follows:

Figure 1: Retaining path of an object leaked via iframe and event listener.

Note that the retaining path crosses the JavaScript / DOM boundary (highlighted in green/red, respectively) two times. The JavaScript objects live in the V8 heap, while DOM objects are C++ objects in Chrome.

DevTools heap snapshot

We can inspect the retaining path of any object by taking a heap snapshot in DevTools. The heap snapshot precisely captures all objects on the V8 heap. Up until recently it had only approximate information about the C++ DOM objects. For instance, Chrome 65 shows an incomplete retaining path for the Leak object from the toy example:

Figure 2: Retaining path in Chrome 65.

Only the first row is precise: the Leak object is indeed stored in the global_variable of the iframe’s window object. Subsequent rows approximate the real retaining path and make debugging of the memory leak hard.

As of Chrome 66, DevTools traces through C++ DOM objects and precisely captures the objects and references between them. This is based on the powerful C++ object tracing mechanism that was introduced for cross-component garbage collection earlier. As a result, the retaining path in DevTools is actually correct now:

Figure 3: Retaining path in Chrome 66.

Under the hood: cross-component tracing

DOM objects are managed by Blink — the rendering engine of Chrome, which is responsible for translating the DOM into actual text and images on the screen. Blink and its representation of the DOM are written in C++ which means that the DOM cannot be directly exposed to JavaScript. Instead, objects in the DOM come in two halves: a V8 wrapper object available to JavaScript and a C++ object representing the node in the DOM. These objects have direct references to each other. Determining liveness and ownership of objects across multiple components, such as Blink and V8, is difficult because all involved parties need to agree on which objects are still alive and which ones can be reclaimed.

In Chrome 56 and older versions (i.e. until Mar 2017), Chrome used a mechanism called object grouping to determine liveness. Objects were assigned groups based on containment in documents. A group with all of its containing objects was kept alive as long as a single object was kept alive through some other retaining path. This made sense in the context of DOM nodes that always refer to their containing document, forming so-called DOM trees. However, this abstraction removed all of the actual retaining paths which made it hard to use for debugging as shown in Figure 2. In the case of objects that did not fit this scenario, e.g. JavaScript closures used as event listeners, this approach also became cumbersome and led to various bugs where JavaScript wrapper objects would prematurely get collected, which resulted in them being replaced by empty JS wrappers that would lose all their properties.

Starting from Chrome 57, this approach was replaced by cross-component tracing, which is a mechanism that determines liveness by tracing from JavaScript to the C++ implementation of the DOM and back. We implemented incremental tracing on the C++ side with write barriers to avoid any stop-the-world tracing jank we’ve been talking about in previous blog posts. Cross-component tracing does not only provide better latency but also approximates liveness of objects across component boundaries better and fixes several scenarios that used to cause leaks. On top of that, it allows DevTools to provide a snapshot that actually represents the DOM, as shown in Figure 3.

Try it out! We are happy to hear your feedback.

Posted by Ulan Degenbaev, Alexei Filippov, Michael Lippautz, and Hannes Payer — the fellowship of the DOM

Background compilation

$
0
0

TL;DR: Starting with Chrome 66, V8 compiles JavaScript source code on a background thread, reducing the amount of time spent compiling on the main thread by between 5% to 20% on typical websites.

Background

Since version 41, Chrome has supported parsing of JavaScript source files on a background thread via V8’s StreamedSource API. This enables V8 to start parsing JavaScript source code as soon as Chrome has downloaded the first chunk of the file from the network, and to continue parsing in parallel while Chrome streams the file over the network. This can provide considerable loading time improvements since V8 can be almost finished parsing the JavaScript by the time the file has finished downloading.

However, due to limitations in V8’s original baseline compiler, V8 still needed to go back to the main thread to finalize parsing and compile the script into JIT machine code that would execute the script’s code. With the switch to our new Ignition + TurboFan pipeline, we are now able to move bytecode compilation to the background thread as well, thereby freeing up Chrome’s main-thread to deliver a smoother, more responsive web browsing experience.

Building a background thread bytecode compiler

V8’s Ignition bytecode compiler takes the abstract syntax tree (AST) produced by the parser as input and produces a stream of bytecode (BytecodeArray) along with associated meta-data which enables the Ignition interpreter to execute the JavaScript source.

Ignition’s bytecode compiler was built with multi-threading in mind, however a number of changes were required throughout the compilation pipeline to enable background compilation. One of the main changes was to prevent the compilation pipeline from accessing objects in V8’s JavaScript heap while running on the background thread. Objects in V8’s heap are not thread-safe, since Javascript is single-threaded, and might be modified by the main-thread or V8’s garbage collector during background compilation.

There were two main stages of the compilation pipeline which accessed objects on V8’s heap: AST internalization, and bytecode finalization. AST internalization is a process by which literal objects (strings, numbers, object-literal boilerplate, etc.) identified in the AST are allocated on the V8 heap, such that they can be used directly by the generated bytecode when the script is executed. This process traditionally happened immediately after the parser built the AST. As such, there were a number of steps later in the compilation pipeline that relied on the literal objects having been allocated. To enable background compilation we moved AST internalization later in the compilation pipeline, after the bytecode had been compiled. This required modifications to the later stages of the pipeline to access the raw literal values embedded in the AST instead of internalized on-heap values.

Bytecode finalization involves building the final BytecodeArray object, used to execute the function, alongside associated metadata — for example, a ConstantPoolArray which stores constants referred to by the bytecode, and a SourcePositionTable which maps the JavaScript source line and column numbers to bytecode offset. Since JavaScript is a dynamic language, these objects all need to live in the JavaScript heap to enable them to be garbage-collected if the JavaScript function associated with the bytecode is collected. Previously some of these metadata objects would be allocated and modified during bytecode compilation, which involved accessing the JavaScript heap. In order to enable background compilation, Ignition’s bytecode generator was refactored to keep track of the details of this metadata and defer allocating them on the JavaScript heap until the very final stages of compilation.

With these changes, almost all of the script’s compilation can be moved to a background thread, with only the short AST internalization and bytecode finalization steps happening on the main thread just before script execution.

Currently, only top-level script code and immediately invoked function expressions (IIFEs) are compiled on a background thread — inner functions are still compiled lazily (when first executed) on the main thread. We are hoping to extend background compilation to more situations in the future. However, even with these restrictions, background compilation leaves the main thread free for longer, enabling it to do other work such as reacting to user-interaction, rendering animations or otherwise producing a smoother more responsive experience.

Results

We evaluated the performance of background compilation using our real-world benchmarking framework across a set of popular webpages.

The proportion of compilation that can happen on a background thread varies depending on the proportion of bytecode compiled during top-level streaming-script compilation verses being lazy compiled as inner functions are invoked (which must still occur on the main thread). As such, the proportion of time saved on the main thread varies, with most pages seeing between 5% to 20% reduction in main-thread compilation time.

Next steps

What’s better than compiling a script on a background thread? Not having to compile the script at all! Alongside background compilation we have also been working on improving V8’s code-caching system to expand the amount of code cached by V8, thereby speeding up page loading for sites you visit often. We hope to bring you updates on this front soon. Stay tuned!

Posted by Ross McIlroy, main thread defender

V8 release v6.6

$
0
0

Every six weeks, we create a new branch of V8 as part of our release process. Each version is branched from V8’s Git master immediately before a Chrome Beta milestone. Today we’re pleased to announce our newest branch, V8 version 6.6, which is in beta until its release in coordination with Chrome 66 Stable in several weeks. V8 v6.6 is filled with all sorts of developer-facing goodies. This post provides a preview of some of the highlights in anticipation of the release.

JavaScript language features

Function.prototype.toString() now returns exact slices of source code text, including whitespace and comments. Here’s an example comparing the old and the new behavior:

// Note the comment between the `function` keyword
// and the function name, as well as the space following
// the function name.
function /* acomment */ foo () {}

// Previously:
foo.toString();
// → 'function foo() {}'
// ^ no comment
// ^ no space

// Now:
foo.toString();
// → 'function /* comment */ foo () {}'

Line separator (U+2028) and paragraph separator (U+2029) symbols are now allowed in string literals, matching JSON. Previously, these symbols were treated as line terminators within string literals, and so using them resulted in a SyntaxError exception.

The catch clause of try statements can now be used without a parameter. This is useful if you don’t have a need for the exception object in the code that handles the exception.

try {
doSomethingThatMightThrow();
} catch { // → Look mom, no binding!
handleException();
}

In addition to String.prototype.trim(), V8 now implements String.prototype.trimStart() and String.prototype.trimEnd(). This functionality was previously available through the non-standard trimLeft() and trimRight() methods, which remain as aliases of the new methods for backward compatibility.

const string = '  hello world  ';
string.trimStart();
// → 'hello world '
string.trimEnd();
// → ' hello world'
string.trim();
// → 'hello world'

The Array.prototype.values() method gives arrays the same iteration interface as the ES2015 Map and Set collections: all can now be iterated over by keys, values, or entries by calling the same-named method. This change has the potential to be incompatible with existing JavaScript code. If you discover odd or broken behavior on a website, please try to disable this feature via chrome://flags/#enable-array-prototype-values and file an issue.

Code caching after execution

The terms cold and warm load might be well-known for people concerned about loading performance. In V8, there is also the concept of a hot load. Let’s explain the different levels with Chrome embedding V8 as an example:

  • Cold load: Chrome sees the visited web page for the first time and does not have any data cached at all.
  • Warm load: Chrome remembers that the web page was already visited and can retrieve certain assets (e.g. images and script source files) from the cache. V8 recognizes that the page shipped the same script file already, and therefore caches the compiled code along with the script file in the disk cache.
  • Hot load: The third time Chrome visits the web page, when serving script file from the disk cache, it also provides V8 with the code cached during the previous load. V8 can use this cached code to avoid having to parse and compile the script from scratch.

Before V8 v6.6 we cached the generated code immediately after the top-level compile. V8 only compiles the functions that are known to be immediately executed during the top-level compile and marks other functions for lazy compilation. This meant that cached code only included top-level code, while all other functions had to be lazily compiled from scratch on each page load. Beginning with version 6.6, V8 caches the code generated after the script’s top-level execution. As we execute the script, more functions are lazily compiled and can be included in the cache. As a result, these functions don’t need to be compiled on future page loads, reducing compile and parse time in hot load scenarios by between 20–60%. The visible user change is a less congested main thread, thus a smoother and faster loading experience.

Look out for a detailed blog post on this topic soon.

Background compilation

For some time V8 has been able to parse JavaScript code on a background thread. With V8’s new Ignition bytecode interpreter that shipped last year, we were able to extend this support to also enable compilation of the JavaScript source to bytecode on a background thread. This enables embedders to perform more work off the main thread, freeing it up to execute more JavaScript and reduce jank. We enabled this feature in Chrome 66, where we see between 5% to 20% reduction on main-thread compilation time on typical websites. For more details, please see the recent blog post on this feature.

Removal of AST numbering

We have continued to reap benefits from simplifying our compilation pipeline after the Ignition and TurboFan launch last year. Our previous pipeline required a post-parsing stage called "AST Numbering", where nodes in the generated abstract syntax tree were numbered so that the various compilers using it would have a common point of reference.

Over time this post-processing pass had ballooned to include other functionality: numbering suspend point for generators and async functions, collecting inner functions for eager compilation, initializing literals or detecting unoptimizable code patterns.

With the new pipeline, the Ignition bytecode became the common point of reference, and the numbering itself was no longer required — but, the remaining functionality was still needed, and the AST numbering pass remained.

In V8 v6.6, we finally managed to move out or deprecate this remaining functionality into other passes, allowing us to remove this tree walk. This resulted in a 3-5% improvement in real-world compile time.

Asynchronous performance improvements

We managed to squeeze out some nice performance improvements for promises and async functions, and especially managed to close the gap between async functions and desugared promise chains.

In addition, the performance of async generators and async iteration was improved significantly, making them a viable option for the upcoming Node 10 LTS, which is scheduled to include V8 v6.6. As an example, consider the following Fibonacci sequence implementation:

asyncfunction* fibonacciSequence() {
for (let a = 0, b = 1;;) {
yield a;
const c = a + b;
a = b;
b = c;
}
}

asyncfunctionfibonacci(id, n) {
forawait (const value of fibonacciSequence()) {
if (n-- === 0) return value;
}
}

We’ve measured the following improvements for this pattern, before and after Babel transpilation:

Finally, bytecode improvements to “suspendable functions” such as generators, async functions, and modules, have improved the performance of these functions while running in the interpreter, and decreased their compiled size. We’re planning on improving the performance of async functions and async generators even further with upcoming releases, so stay tuned.

Array performance improvements

The throughput performance of Array#reduce was increased by more than 10× for holey double arrays (see our blog post for an explanation what holey and packed arrays are). This widens the fast-path for cases where Array#reduce is applied to holey and packed double arrays.

Untrusted code mitigations

In V8 v6.6 we’ve landed more mitigations for side-channel vulnerabilities to prevent information leaks to untrusted JavaScript and WebAssembly code.

GYP is gone

This is the first V8 version that officially ships without GYP files. If your product needs the deleted GYP files, you need to copy them into your own source repository.

Memory profiling

Chrome’s DevTools can now trace and snapshot C++ DOM objects and display all reachable DOM objects from JavaScript with their references. This feature is one of the benefits of the new C++ tracing mechanism of the V8 garbage collector. For more information please have a look at the dedicated blog post.

V8 API

Please use git log branch-heads/6.5..branch-heads/6.6 include/v8.h to get a list of the API changes.

Developers with an active V8 checkout can use git checkout -b 6.6 -t branch-heads/6.6 to experiment with the new features in V8 v6.6. Alternatively you can subscribe to Chrome’s Beta channel and try the new features out yourself soon.

Posted by the V8 team

Improved code caching

$
0
0

V8 uses code caching to cache the generated code for frequently-used scripts. Starting with Chrome 66, we are caching more code by generating the cache after top-level execution. This leads to a 20-40% reduction in parse and compilation time during the initial load.

Background

V8 uses two kinds of code caching to cache generated code to be reused later. The first is the in-memory cache that is available within each instance of V8. The code generated after the initial compile is stored into this cache, keyed on the source string. This is available for reuse within the same instance of V8. The other kind of code caching serializes the generated code and stores it on disk for future use. This cache is not specific to a particular instance of V8 and can be used across different instances of V8. This blog post focuses on this second kind of code caching as used in Chrome. (Other embedders also use this kind of code caching; it’s not limited to Chrome. However, this blog post only focuses on the usage in Chrome.)

Chrome stores the serialized generated code onto the disk cache and keys it with the URL of the script resource. When loading a script, Chrome checks the disk cache. If the script is already cached, Chrome passes the serialized data to V8 as a part of compile request. V8 then deserializes this data instead of parsing and compiling the script. There are also additional checks involved to ensure that the code is still usable (for example: a version mismatch makes the cached data unusable).

Real-world data shows that the code cache hit rates (for scripts that could be cached) is high (~86%). Though the cache hit rates are high for these scripts, the amount of code we cache per script is not very high. Our analysis showed that increasing the amount of code that is cached would reduce the time spent in parsing and compiling JavaScript code by around 40%.

Increasing the amount of code that is cached

In the previous approach, code caching was coupled with the requests to compile the script.

Embedders could request that V8 serialize the code it generated during its top-level compilation of a new JavaScript source file. V8 returned the serialized code after compiling the script. When Chrome requests the same script again, V8 fetches the serialized code from the cache and deserializes it. V8 completely avoids recompiling functions that are already in the cache. These scenarios are shown in the following figure:

V8 only compiles the functions that are expected to be immediately executed (IIFEs) during the top-level compile and marks other functions for lazy compilation. This helps improve page load times by avoiding compiling functions that are not required, however it means that the serialized data only contains the code for the functions that are eagerly compiled.

Prior to Chrome 59, we had to generate the code cache before any execution has started. The earlier baseline compiler of V8 (Full-codegen), generates specialized code for the execution context. Full-codegen used code patching to fast-path operations for the specific execution context. Such code cannot be serialized easily by removing the context specific data to be used in other execution contexts.

With the launch of Ignition in Chrome 59, this restriction is no longer necessary. Ignition uses data-driven inline caches to fast-path operations in the current execution context. The context-dependent data is stored in feedback vectors and is separate from the generated code. This has opened the possibility of generating code caches even after the execution of the script. As we execute the script, more functions (that were marked for lazy compile) are compiled, allowing us to cache more code.

V8 exposes a new API, ScriptCompiler::CreateCodeCache, to request code caches independent of the compile requests. Requesting code caches along with compile requests is deprecated and would not work in V8 v6.6 onwards. Since version 66, Chrome uses this API to request the code cache after the top-level execute. The following figure shows the new scenario of requesting the code cache. The code cache is requested after the top level execute and hence contains the code for functions that were compiled later during the execution of the script. In the later runs (shown as hot runs in the following figure), it avoids compilation of functions during top level execute.

Results

The performance of this feature is measured using our internal real-world benchmarks. The following graph shows the reduction in the parse and compile time over the earlier caching scheme. There is a reduction of around 20–40% in both parse and compilation time on most of the pages.

Data from the wild shows similar results with a 20–40% reduction in the time spent in compiling JavaScript code both on desktop and mobile. On Android, this optimization also translates to a 1–2% reduction in the top-level page-load metrics like the time a webpage takes to become interactive. We also monitored the memory and disk usage of Chrome and did not see any noticeable regressions.

Posted by Mythri Alle, Chief Code Cacher

Adding BigInts to V8

$
0
0

Over the past couple of months, we have implemented support for BigInts in V8, as currently specified by this proposal, to be included in a future version of ECMAScript. The following post tells the story of our adventures.

TL;DR

As a JavaScript programmer, you now1 have integers with arbitrary2 precision in your toolbox:

const a = 2172141653n;
const b = 15346349309n;
a * b;
// → 33334444555566667777n // Yay!
Number(a) * Number(b);
// → 33334444555566670000 // Boo!
const such_many = 2n ** 222n;
// → 6739986666787659948666753771754907668409286105635143120275902562304n

For details about the new functionality and how it could be used, refer to our in-depth Web Fundamentals article on BigInt. We are looking forward to seeing the awesome things you’ll build with them!

1Now if you run Chrome Beta, Dev, or Canary, or a preview Node.js version, otherwise soon (Chrome 67, Node.js master probably around the same time).

2 Arbitrary up to an implementation-defined limit. Sorry, we haven’t yet figured out how to squeeze an infinite amount of data into your computer’s finite amount of memory.

Representing BigInts in memory

Typically, computers store integers in their CPU’s registers (which nowadays are usually 32 or 64 bits wide), or in register-sized chunks of memory. This leads to the minimum and maximum values you might be familiar with. For example, a 32-bit signed integer can hold values from -2,147,483,648 to 2,147,483,647. The idea of BigInts, however, is to not be restricted by such limits.

So how can one store a BigInt with a hundred, or a thousand, or a million bits? It can’t fit in a register, so we allocate an object in memory. We make it large enough to hold all the BigInt’s bits, in a series of chunks, which we call “digits” — because this is conceptually very similar to how one can write bigger numbers than “9” by using more digits, like in “10”; except where the decimal system uses digits from 0 to 9, our BigInts use digits from 0 to 4294967295 (i.e. 2**32-1). That’s the value range of a 32-bit CPU register3, without a sign bit; we store the sign bit separately. In pseudo-code, a BigInt object with 3*32 = 96 bits looks like this:

{
type: 'BigInt',
sign: 0,
num_digits: 3,
digits: [0x12…, 0x34…, 0x56…],
}

3 On 64-bit machines, we use 64-bit digits, i.e. from 0 to 18446744073709551615 (i.e. 2n**64n-1n).

Back to school, and back to Knuth

Working with integers kept in CPU registers is really easy: to e.g. multiply two of them, there’s a machine instruction which software can use to tell the CPU “multiply the contents of these two registers!”, and the CPU will do it. For BigInt arithmetic, we have to come up with our own solution. Thankfully this particular task is something that quite literally every child at some point learns how to solve: remember what you did back in school when you had to multiply 345 * 678 and weren’t allowed to use a calculator?

345 * 678
---------
30 // 5 * 6
+ 24 // 4 * 6
+ 18 // 3 * 6
+ 35 // 5 * 7
+ 28 // 4 * 7
+ 21 // 3 * 7
+ 40 // 5 * 8
+ 32 // 4 * 8
+ 24 // 3 * 8
=========
233910

That’s exactly how V8 multiplies BigInts: one digit at a time, adding up the intermediate results. The algorithm works just as well for 0 to 9 as it does for a BigInt’s much bigger digits.

Donald Knuth published a specific implementation of multiplication and division of large numbers made up of smaller chunks in Volume 2 of his classic The Art of Computer Programming, all the way back in 1969. V8’s implementation follows this book, which shows that this a pretty timeless piece of computer science.

“Less desugaring” == more sweets?

Perhaps surprisingly, we had to spend quite a bit of effort on getting seemingly simple unary operations, like -x, to work. So far, -x did exactly the same as x * (-1), so to simplify things, V8 applied precisely this replacement as early as possible when processing JavaScript, namely in the parser. This approach is called “desugaring”, because it treats an expression like -x as “syntactic sugar” for x * (-1). Other components (the interpreter, the compiler, the entire runtime system) didn’t even need to know what a unary operation is, because they only ever saw the multiplication, which of course they must support anyway.

With BigInts, however, this implementation suddenly becomes invalid, because multiplying a BigInt with a Number (like -1) must throw a TypeError4. The parser would have to desugar -x to x * (-1n) if x is a BigInt — but the parser has no way of knowing what x will evaluate to. So we had to stop relying on this early desugaring, and instead add proper support for unary operations on both Numbers and BigInts everywhere.

4 Mixing BigInt and Number operand types is generally not allowed. That’s somewhat unusual for JavaScript, but there is an explanation for this decision.

A bit of fun with bitwise ops

Most computer systems in use today store signed integers using a neat trick called “two’s complement”, which has the nice properties that the first bit indicates the sign, and adding 1 to the bit pattern always increments the number by 1, taking care of the sign bit automatically. For example, for 8-bit integers:

  • 10000000 is -128, the lowest representable number,
  • 10000001 is -127,
  • 11111111 is -1,
  • 00000000 is 0,
  • 00000001 is 1,
  • 01111111 is 127, the highest representable number.

This encoding is so common that many programmers expect it and rely on it, and the BigInt specification reflects this fact by prescribing that BigInts must act as if they used two’s complement representation. As described above, V8’s BigInts don’t!

To perform bitwise operations according to spec, our BigInts therefore must pretend to be using two’s complement under the hood. For positive values, it doesn’t make a difference, but negative numbers must do extra work to accomplish this. That has the somewhat surprising effect that a & b, if a and b are both negative BigInts, actually performs four steps (as opposed to just one if they were both positive): both inputs are converted to fake-two’s-complement format, then the actual operation is done, then the result is converted back to our real representation. Why the back-and-forth, you might ask? Because all the non-bitwise operations are much easier that way.

Two new types of TypedArrays

The BigInt proposal includes two new TypedArray flavors: BigInt64Array and BigUint64Array. We can have TypedArrays with 64-bit wide integer elements now that BigInts provide a natural way to read and write all the bits in those elements, whereas if one tried to use Numbers for that, some bits might get lost. That’s why the new arrays aren’t quite like the existing 8/16/32-bit integer TypedArrays: accessing their elements is always done with BigInts; trying to use Numbers throws an exception.

> const big_array = new BigInt64Array(1);
> big_array[0] = 123n; // OK
> big_array[0]
123n
> big_array[0] = 456;
TypeError: Cannot convert 456 to a BigInt
> big_array[0] = BigInt(456); // OK

Just like JavaScript code working with these types of arrays looks and works a bit different from traditional TypedArray code, we had to generalize our TypedArray implementation to behave differently for the two newcomers.

Optimization considerations

For now, we are shipping a baseline implementation of BigInts. It is functionally complete and should provide solid performance (a little bit faster than existing userland libraries), but it is not particularly optimized. The reason is that, in line with our aim to prioritize real-world applications over artificial benchmarks, we first want to see how you will use BigInts, so that we can then optimize precisely the cases you care about!

For example, if we see that relatively small BigInts (up to 64 bits) are an important use case, we could make those more memory-efficient by using a special representation for them:

{
type: 'BigInt-Int64',
value: 0x12…,
}

One of the details that remain to be seen is whether we should do this for “int64” value ranges, “uint64” ranges, or both — keeping in mind having to support fewer fast paths means that we can ship them sooner, and also that every additional fast path ironically makes everything else a bit slower, because affected operations always have to check whether it is applicable.

Another story is support for BigInts in the optimizing compiler. For computationally heavy applications operating on 64-bit values and running on 64-bit hardware, keeping those values in registers would be much more efficient than allocating them as objects on the heap as we currently do. We have plans for how we would implement such support, but it is another case where we would first like to find out whether that is really what you, our users, care about the most; or whether we should spend our time on something else instead.

Please send us feedback on what you’re using BigInts for, and any issues you encounter! You can reach us at our bug tracker crbug.com/v8/new, via mail to v8-users@googlegroups.com, or @v8js on Twitter.

Posted by Jakob Kummerow, arbitrator of precision

V8 release v6.7

$
0
0

Every six weeks, we create a new branch of V8 as part of our release process. Each version is branched from V8’s Git master immediately before a Chrome Beta milestone. Today we’re pleased to announce our newest branch, V8 version 6.7, which is in beta until its release in coordination with Chrome 67 Stable in several weeks. V8 v6.7 is filled with all sorts of developer-facing goodies. This post provides a preview of some of the highlights in anticipation of the release.

JavaScript language features

V8 v6.7 ships with BigInt support enabled by default. BigInts are a new numeric primitive in JavaScript that can represent integers with arbitrary precision. Read the Web Fundamentals article on BigInt for more info on how BigInts can be used in JavaScript, and check out our write-up with more details about the V8 implementation.

Untrusted code mitigations

In V8 v6.7 we’ve landed more mitigations for side-channel vulnerabilities to prevent information leaks to untrusted JavaScript and WebAssembly code.

V8 API

Please use git log branch-heads/6.6..branch-heads/6.7 include/v8.h to get a list of the API changes.

Developers with an active V8 checkout can use git checkout -b 6.7 -t branch-heads/6.7 to experiment with the new features in V8 v6.7. Alternatively you can subscribe to Chrome’s Beta channel and try the new features out yourself soon.

Posted by the V8 team

Concurrent marking in V8

$
0
0

This post describes the garbage collection technique called concurrent marking. The optimization allows a JavaScript application to continue execution while the garbage collector scans the heap to find and mark live objects. Our benchmarks show that concurrent marking reduces the time spent marking on the main thread by 60%–70%. Concurrent marking is the last puzzle piece of the Orinoco project— the project to incrementally replace the old garbage collector with the new mostly concurrent and parallel garbage collector. Concurrent marking is enabled by default in Chrome 64 and Node.js v10.

Background

Marking is a phase of V8’s Mark-Compact garbage collector. During this phase the collector discovers and marks all live objects. Marking starts from the set of known live objects such as the global object and the currently active functions — the so-called roots. The collector marks the roots as live and follows the pointers in them to discover more live objects. The collector continues marking the newly discovered objects and following pointers until there are no more objects to mark. At the end of marking, all unmarked objects on the heap are unreachable from the application and can be safely reclaimed.

We can think of marking as a graph traversal. The objects on the heap are nodes of the graph. Pointers from one object to another are edges of the graph. Given a node in the graph we can find all out-going edges of that node using the hidden class of the object.

Figure 1. Object graph

V8 implements marking using two mark-bits per object and a marking worklist. Two mark-bits encode three colors: white (00), grey (10), and black (11). Initially all objects are white, which means that the collector has not discovered them yet. A white object becomes grey when the collector discovers it and pushes it onto the marking worklist. A grey object becomes black when the collector pops it from the marking worklist and visits all its fields. This scheme is called tri-color marking. Marking finishes when there are no more grey objects. All the remaining white objects are unreachable and can be safely reclaimed.

Figure 2. Marking starts from the roots.
Figure 3. The collector turns a grey object into black by processing its pointers.
Figure 4. The final state after marking is finished
Figure 4. The final state after marking is finished.

Note that the marking algorithm described above works only if the application is paused while marking is in progress. If we allow the application to run during marking, then the application can change the graph and eventually trick the collector into freeing live objects.

Reducing marking pause

Marking performed all at once can take several hundred milliseconds for large heaps.

Such long pauses can make applications unresponsive and result in poor user experience. In 2011 V8 switched from the stop-the-world marking to incremental marking. During incremental marking the garbage collector splits up the marking work into smaller chunks and allows the application to run between the chunks:

The garbage collector chooses how much incremental marking work to perform in each chunk to match the rate of allocations by the application. In common cases this greatly improves the responsiveness of the application. For large heaps under memory pressure there can still be long pauses as the collector tries to keep up with the allocations.

Incremental marking does not come for free. The application has to notify the garbage collector about all operations that change the object graph. V8 implements the notification using a Dijkstra-style write-barrier. After each write operation of the form object.field = value in JavaScript, V8 inserts the write-barrier code:

// Called after `object.field = value`.
write_barrier(object, field_offset, value) {
if (color(object) == black && color(value) == white) {
set_color(value, grey);
marking_worklist.push(value);
}
}

The write-barrier enforces the invariant that no black object points to a white object. This is also known as the strong tri-color invariant and guarantees that the application cannot hide a live object from the garbage collector, so all white objects at the end of marking are truly unreachable for the application and can be safely freed.

Incremental marking integrates nicely with idle time garbage collection scheduling as described in an earlier blog post. Chrome’s Blink task scheduler can schedule small incremental marking steps during idle time on the main thread without causing jank. This optimization works really well if idle time is available.

Because of the write-barrier cost, incremental marking may reduce throughput of the application. It is possible to improve both throughput and pause times by making use of additional worker threads. There are two ways to do marking on worker threads: parallel marking and concurrent marking.

Parallel marking happens on the main thread and the worker threads. The application is paused throughout the parallel marking phase. It is the multi-threaded version of the stop-the-world marking.

Concurrent marking happens mostly on the worker threads. The application can continue running while concurrent marking is in progress.

The following two sections describe how we added support for parallel and concurrent marking in V8.

Parallel marking

During parallel marking we can assume that the application is not running concurrently. This substantially simplifies the implementation because we can assume that the object graph is static and does not change. In order to mark the object graph in parallel, we need to make the garbage collector data structures thread-safe and find a way to efficiently share marking work between threads. The following diagram shows the data-structures involved in parallel marking. The arrows indicate the direction of data flow. For simplicity, the diagram omits data-structures that are needed for heap defragmentation.

Figure 5. Data-structures for parallel marking
Figure 5. Data structures for parallel marking

Note that the threads only read from the object graph and never change it. The mark-bits of the objects and the marking worklist have to support read and write accesses.

Marking worklist and work stealing

The implementation of the marking worklist is critical for performance and balances fast thread-local performance with how much work can be distributed to other threads in case they run out of work to do.

The extreme sides in that trade-off space are (a) using a completely concurrent data structure for best sharing as all objects can potentially be shared and (b) using a completely thread-local data structure where no objects can be shared, optimizing for thread-local throughput. Figure 6 shows how V8 balances these needs by using a marking worklist that is based on segments for thread-local insertion and removal. Once a segment becomes full it is published to a shared global pool where it is available for stealing. This way V8 allows marking threads to operate locally without any synchronization as long as possible and still handle cases where a single thread reaches a new sub-graph of objects while another thread starves as it completely drained its local segments.

Figure 6. Marking worklist

Concurrent marking

Concurrent marking allows JavaScript to run on the main thread while worker threads are visiting objects on the heap. This opens the door for many potential data races. For example, JavaScript may be writing to an object field at the same time as a worker thread is reading the field. The data races may confuse the garbage collector to free a live object or to mix up primitive values with pointers.

Each operation on the main thread that changes the object graph is a potential source of a data race. Since V8 is a high-performance engine with many object layout optimizations, the list of potential data race sources is rather long. Here is a high-level breakdown:

  • Object allocation.
  • Write to an object field.
  • Object layout changes.
  • Deserialization from the snapshot.
  • Materialization during deoptimization of a function.
  • Evacuation during young generation garbage collection.
  • Code patching.

The main thread needs to synchronize with the worker threads on these operations. The cost and complexity of synchronization depends on the operation. Most operations allow lightweight synchronization with atomic memory accesses, but a few operations require exclusive access to the object. In the following subsections we highlight some of the interesting cases.

Write barrier

The data race caused by a write to an object field is resolved by turning the write operation into a relaxed atomic write and tweaking the write barrier:

// Called after atomic_relaxed_write(&object.field, value);
write_barrier(object, field_offset, value) {
if (color(value) == white && atomic_color_transition(value, white, grey)) {
marking_worklist.push(value);
}
}

Compare it with the previously used write barrier:

// Called after `object.field = value`.
write_barrier(object, field_offset, value) {
if (color(object) == black && color(value) == white) {
set_color(value, grey);
marking_worklist.push(value);
}
}

There are two changes:

  1. The color check of the source object (color(object) == black) is gone.
  2. The color transition of the value from white to grey happens atomically.

Without the source object color check the write barrier becomes more conservative, i.e. it may mark objects as live even if those objects are not really reachable. We removed the check to avoid an expensive memory fence that would be needed between the write operation and the write barrier:

atomic_relaxed_write(&object.field, value);
memory_fence();
write_barrier(object, field_offset, value);

Without the memory fence the object color load operation can be reordered before the write operation. If we don’t prevent the reordering, then the write barrier may observe grey object color and bail out, while a worker thread marks the object without seeing the new value. The original write barrier proposed by Dijkstra et al. also does not check the object color. They did it for simplicity, but we need it for correctness.

Bailout worklist

Some operations, for example code patching, require exclusive access to the object. Early on we decided to avoid per-object locks because they can lead to the priority inversion problem, where the main thread has to wait for a worker thread that is descheduled while holding an object lock. Instead of locking an object, we allow the worker thread to bailout from visiting the object. The worker thread does that by pushing the object into the bailout worklist, which is processed only by the main thread:

Figure 7. The bailout worklist

Worker threads bail out on optimized code objects, hidden classes and weak collections because visiting them would require locking or expensive synchronization protocol.

In retrospect, the bailout worklist turned out to be great for incremental development. We started implementation with worker threads bailing out on all object types and added concurrency one by one.

Object layout changes

A field of an object can store three kinds of values: a tagged pointer, a tagged small integer (also known as a Smi), or an untagged value like an unboxed floating-point number. Pointer tagging is a well-known technique that allows efficient representation of unboxed integers. In V8 the least significant bit of a tagged value indicates whether it is a pointer or an integer. This relies on the fact that pointers are word-aligned. The information about whether a field is tagged or untagged is stored in the hidden class of the object.

Some operations in V8 change an object field from tagged to untagged (or vice versa) by transitioning the object to another hidden class. Such an object layout change is unsafe for concurrent marking. If the change happens while a worker thread is visiting the object concurrently using the old hidden class, then two kinds of bugs are possible. First, the worker may miss a pointer thinking that it is an untagged value. The write barrier protects against this kind of bug. Second, the worker may treat an untagged value as a pointer and dereference it, which would result in an invalid memory access typically followed by a program crash. In order to handle this case we use a snapshotting protocol that synchronizes on the mark-bit of the object. The protocol involves two parties: the main thread changing an object field from tagged to untagged and the worker thread visiting the object. Before changing the field, the main thread ensures that the object is marked as black and pushes it into the bailout worklist for visiting later on:

atomic_color_transition(object, white, grey);
if (atomic_color_transition(object, grey, black)) {
// The object will be revisited on the main thread during draining
// of the bailout worklist.
bailout_worklist.push(object);
}
unsafe_object_layout_change(object);

As shown in the code snippet below, the worker thread first loads the hidden class of the object and snapshots all the pointer fields of the object specified by the hidden class using atomic relaxed load operations. Then it tries to mark the object black using an atomic compare and swap operation. If marking succeeded then this means that the snapshot must be consistent with the hidden class because the main thread marks the object black before changing its layout.

snapshot = [];
hidden_class = atomic_relaxed_load(&object.hidden_class);
for (field_offset in pointer_field_offsets(hidden_class)) {
pointer = atomic_relaxed_load(object + field_offset);
snapshot.add(field_offset, pointer);
}
if (atomic_color_transition(object, grey, black)) {
visit_pointers(snapshot);
}

Note that a white object that undergoes an unsafe layout change has to be marked on the main thread. Unsafe layout changes are relatively rare, so this does not have a big impact on performance of real world applications.

Putting it all together

We integrated concurrent marking into the existing incremental marking infrastructure. The main thread initiates marking by scanning the roots and filling the marking worklist. After that it posts concurrent marking tasks on the worker threads. The worker threads help the main thread to make faster marking progress by cooperatively draining the marking worklist. Once in a while the main thread participates in marking by processing the bailout worklist and the marking worklist. Once the marking worklists become empty, the main thread finalizes garbage collection. During finalization the main thread re-scans the roots and may discover more white objects. Those objects are marked in parallel with the help of worker threads.

Results

Our real-world benchmarking framework shows about 65% and 70% reduction in main thread marking time per garbage collection cycle on mobile and desktop respectively.

Concurrent marking also reduces garbage collection jank in Node.js. This is particularly important since Node.js never implemented idle time garbage collection scheduling and therefore was never able to hide marking time in non-jank-critical phases. Concurrent marking shipped in Node.js v10.

Posted by Ulan Degenbaev, Michael Lippautz, and Hannes Payer — main thread liberators


V8 release v6.8

$
0
0

Every six weeks, we create a new branch of V8 as part of our release process. Each version is branched from V8’s Git master immediately before a Chrome Beta milestone. Today we’re pleased to announce our newest branch, V8 version 6.8, which is in beta until its release in coordination with Chrome 68 Stable in several weeks. V8 v6.8 is filled with all sorts of developer-facing goodies. This post provides a preview of some of the highlights in anticipation of the release.

Memory

JavaScript functions unnecessarily kept outer functions and their metadata (known as SharedFunctionInfo or SFI) alive. Especially in function-heavy code that relies on short-lived IIFEs, this could lead to spurious memory leaks. Before this change, an active Context (i.e. an on-heap representation of a function activation) kept the SFI alive of the function that created the context:

By letting the Context point to a ScopeInfo object which contains the stripped-down information necessary for debugging, we can break the dependency on the SFI.

We’ve already observed 3% V8 memory improvements on mobile devices over a set of top 10 pages.

In parallel we have reduced the memory consumption of SFIs themselves, removing unnecessary fields or compressing them where possible, and decreased their size by ~25%, with further reductions coming in future releases. We’ve observed SFIs taking up 2–6% of V8 memory on typical websites even after detaching them from the context, so you should see memory improvements on code with a large number of functions.

Performance

Array destructuring improvements

The optimizing compiler did not generate ideal code for array destructuring. For example, swapping variables using [a, b] = [b, a] used to be twice as slow as const tmp = a; a = b; b = tmp. Once we unblocked escape analysis to eliminate all temporary allocation, array destructuring with a temporary array is as fast as a sequence of assignments.

Object.assign improvements

So far Object.assign had a fast path written in C++. That meant that the JavaScript-to-C++ boundary had to be crossed for each Object.assign call. An obvious way to improve the builtin performance was to implement a fast path on the JavaScript side. We had two options: either implement it as an native JS builtin (which would come with some unnecessary overhead in this case), or implement it using CodeStubAssembler technology (which provides more flexibility). We went with the latter solution. The new implementation of Object.assign improves the score of Speedometer2/React-Redux by about 15%, improving the total Speedometer 2 score by 1.5%.

TypedArray.prototype.sort improvements

TypedArray.prototype.sort has two paths: a fast path, used when the user does not provide a comparison function, and a slow path for everything else. Until now, the slow path reused the implementation for Array.prototype.sort, which does a lot more than is necessary for sorting TypedArrays. V8 v6.8 replaces the slow path with an implementation in CodeStubAssembler. (Not directly CodeStubAssembler but a domain-specific language that is built on top of CodeStubAssembler).

Performance for sorting TypedArrays without a comparison function stays the same while there is a speedup of up to 2.5× when sorting using a comparison function.

WebAssembly

In V8 v6.8 you can start using trap-based bounds checking on Linux x64 platforms. This memory management optimization considerably improves WebAssembly’s execution speed. It’s already used in Chrome 68, and in the future more platforms will be supported incrementally.

V8 API

Please use git log branch-heads/6.7..branch-heads/6.8 include/v8.h to get a list of the API changes.

Developers with an active V8 checkout can use git checkout -b 6.8 -t branch-heads/6.8 to experiment with the new features in V8 v6.8. Alternatively you can subscribe to Chrome’s Beta channel and try the new features out yourself soon.

Posted by the V8 team

V8 release v6.9

$
0
0

Every six weeks, we create a new branch of V8 as part of our release process. Each version is branched from V8’s Git master immediately before a Chrome Beta milestone. Today we’re pleased to announce our newest branch, V8 version 6.9, which is in beta until its release in coordination with Chrome 69 Stable in several weeks. V8 v6.9 is filled with all sorts of developer-facing goodies. This post provides a preview of some of the highlights in anticipation of the release.

Memory savings through embedded built-ins

V8 ships with an extensive library of built-in functions. Examples are methods on built-in objects such as Array.prototype.sort and RegExp.prototype.exec, but also a wide range of internal functionality. Because their generation takes a long time, built-in functions are compiled at build-time and serialized into a snapshot, which is later deserialized at runtime to create the initial JavaScript heap state.

Built-in functions currently consume 700 KB in each Isolate (an Isolate roughly corresponds to a browser tab in Chrome). This is quite wasteful, and last year we began working on reducing this overhead. In V8 v6.4, we shipped lazy deserialization, ensuring that each Isolate only pays for the built-ins that it actually needs (but each Isolate still had its own copy).

Embedded built-ins go one step further. An embedded built-in is shared by all Isolates, and embedded into the binary itself instead of copied onto the JavaScript heap. This means that built-ins exist in memory only once regardless of how many Isolates are running, an especially useful property now that Site Isolation has been enabled by default. With embedded built-ins, we’ve seen a median 9% reduction of the V8 heap size over the top 10k websites on x64. Of these sites, 50% save at least 1.2 MB, 30% save at least 2.1 MB, and 10% save 3.7 MB or more.

V8 v6.9 ships with support for embedded built-ins on x64 platforms. Other platforms will follow soon in upcoming releases. Expect more details soon in a dedicated blog post.

Performance


Liftoff, WebAssembly’s new first-tier compiler

WebAssembly got a new baseline compiler for much faster startup of complex websites with big WebAssembly modules (such as Google Earth and AutoCAD). Depending on the hardware we are seeing speedups of more than 10×. Stay tuned for more details in a separate blog post.

Faster DataView operations

DataView methods have been reimplemented in V8 Torque, which spares a costly call to C++ compared to the former runtime implementation. Moreover, we now inline calls to DataView methods when compiling JavaScript code in TurboFan, resulting in even better peak performance for hot code. Using DataViews is now as efficient as using TypedArrays, finally making DataViews a viable choice in performance-critical situations. We’ll be covering this in more detail in an upcoming blog post about DataViews, so stay tuned!

Faster processing of WeakMaps during garbage collection

V8 v6.9 reduces Mark-Compact garbage collection pause times by improving WeakMap processing. Concurrent and incremental marking are now able to process WeakMaps, whereas previously all this work was done in the final atomic pause of Mark-Compact GC. Since not all work can be moved outside of the pause, the GC now also does more work in parallel to further reduce pause times. These optimizations essentially halved the average pause time for Mark-Compact GCs in the Web Tooling Benchmark.

WeakMap processing uses a fixed-point iteration algorithm that can degrade to quadratic runtime behavior in certain cases. With the new release, V8 is now able to switch to another algorithm that is guaranteed to finish in linear time if the GC does not finish within a certain number of iterations. Previously, worst-case examples could be constructed that took the GC a few seconds to finish even with a relatively small heap, while the linear algorithm finishes within a few milliseconds.

V8 API

Please use git log branch-heads/6.8..branch-heads/6.9 include/v8.h to get a list of the API changes.

Developers with an active V8 checkout can use git checkout -b 6.9 -t branch-heads/6.9 to experiment with the new features in V8 v6.9. Alternatively you can subscribe to Chrome’s Beta channel and try the new features out yourself soon.

Posted by the V8 team

Embedded builtins

$
0
0

V8 built-in functions (builtins) consume memory in every instance of V8. The builtin count, average size, and the number of V8 instances per Chrome browser tab have been growing significantly. This blog post describes how we reduced the median V8 heap size per website by 19% over the past year.

Background

V8 ships with an extensive library of JavaScript (JS) built-in functions. Many builtins are directly exposed to JS developers as functions installed on JS built-in objects, such as RegExp.prototype.exec and Array.prototype.sort; other builtins implement various internal functionality. Machine code for builtins is generated by V8’s own compiler, and is loaded onto the managed heap state for every V8 Isolate upon initialization. An Isolate represents an isolated instance of the V8 engine, and every browser tab in Chrome contains at least one Isolate. Every Isolate has its own managed heap, and thus its own copy of all builtins.

Back in 2015, builtins were mostly implemented in self-hosted JS, native assembly, or in C++. They were fairly small, and creating a copy for every Isolate was less problematic.

Much has changed in this space over the last years.

In 2016, V8 began experimenting with builtins implemented in CodeStubAssembler (CSA). This turned out to both be convenient (platform-independent, readable) and to produce efficient code, so CSA builtins became ubiquitous. For a variety of reasons, CSA builtins tend to produce larger code, and the size of V8 builtins roughly tripled as more and more were ported to CSA. By mid-2017, their per-Isolate overhead had grown significantly and we started thinking about a systematic solution.

V8 snapshot size (including builtins) from 2015 until 2017

In late 2017, we implemented lazy builtin (and bytecode handler) deserialization as a first step. Our initial analysis showed that most sites used less than half of all builtins. With lazy deserialization, builtins are loaded on-demand, and unused builtins are never loaded into the Isolate. Lazy deserialization was shipped in Chrome 64 with promising memory savings. But: builtin memory overhead was still linear in the number of Isolates.

Then, Spectre was disclosed, and Chrome ultimately turned on site isolation to mitigate its effects. Site isolation limits a Chrome renderer process to documents from a single origin. Thus, with site isolation, many browsing tabs create more renderer processes and more V8 Isolates. Even though managing per-Isolate overhead has always been important, site isolation has made it even more so.

Embedded builtins

Our goal for this project was to completely eliminate per-Isolate builtin overhead.

The idea behind it was simple. Conceptually, builtins are identical across Isolates, and are only bound to an Isolate because of implementation details. If we could make builtins truly isolate-independent, we could keep a single copy in memory and share them across all Isolates. And if we could make them process-independent, they could even be shared across processes.

In practice, we faced several challenges. Generated builtin code was neither isolate- nor process-independent due to embedded pointers to isolate- and process-specific data. V8 had no concept of executing generated code located outside the managed heap. Builtins had to be shared across processes, ideally by reusing existing OS mechanisms. And finally (this turned out to be the long tail), performance must not noticeably regress.

The following sections describe our solution in detail.

Isolate- and process-independent code

Builtins are generated by V8’s compiler internal pipeline, which embeds references to heap constants (located on the Isolate’s managed heap), call targets (Code objects, also on the managed heap), and to isolate- and process-specific addresses (e.g.: C runtime functions or a pointer to the Isolate itself, also called ’external references’) directly into the code. In x64 assembly, a load of such an object could look as follows:

// Load an embedded address into register rbx.
REX.W movq rbx,0x56526afd0f70

V8 has a moving garbage collector, and the location of the target object could change over time. Should the target be moved during collection, the GC updates the generated code to point at the new location.

On x64 (and most other architectures), calls to other Code objects use an efficient call instruction which specifies the call target by an offset from the current program counter (an interesting detail: V8 reserves its entire CODE_SPACE on the managed heap at startup to ensure all possible Code objects remain within an addressable offset of each other). The relevant part of the calling sequence looks like this:

// Call instruction located at [pc + <offset>].
call <offset>
A pc-relative call

Code objects themselves live on the managed heap and are movable. When they are moved, the GC updates the offset at all relevant call sites.

In order to share builtins across processes, generated code must be immutable as well as isolate- and process-independent. Both instruction sequences above do not fulfill that requirement: they directly embed addresses in the code, and are patched at runtime by the GC.

To address both issues, we introduced an indirection through a dedicated, so-called root register, which holds a pointer into a known location within the current Isolate.

Isolate layout

V8’s Isolate class contains the roots table, which itself contains pointers to root objects on the managed heap. The root register permanently holds the address of the roots table.

The new, isolate- and process-independent way to load a root object thus becomes:

// Load the constant address located at the given
// offset from roots.
REX.W movq rax,[kRootRegister + <offset>]

Root heap constants can be loaded directly from the roots list as above. Other heap constants use an additional indirection through a global builtins constant pool, itself stored on the roots list:

// Load the builtins constant pool, then the
// desired constant.
REX.W movq rax,[kRootRegister + <offset>]
REX.W movq rax,[rax + 0x1d7]

For Code targets, we initially switched to a more involved calling sequence which loads the target Code object from the global builtins constant pool as above, loads the target address into a register, and finally performs an indirect call.

With these changes, generated code became isolate- and process-independent and we could begin working on sharing it between processes.

Sharing across processes

We initially evaluated two alternatives. Builtins could either be shared by mmap-ing a data blob file into memory; or, they could be embedded directly into the binary. We took the latter approach since it had the advantage that we would automatically reuse standard OS mechanisms to share memory across processes, and the change would not require additional logic by V8 embedders such as Chrome. We were confident in this approach since Dart’s AOT compilation had already successfully binary-embedded generated code.

An executable binary file is split into several sections. For example, an ELF binary contains data in the .data (initialized data), .ro_data (initialized read-only data), and .bss (uninitialized data) sections, while native executable code is placed in .text. Our goal was to pack the builtins code into the .text section alongside native code.

Sections of an executable binary file

This was done by introducing a new build step that used V8’s internal compiler pipeline to generate native code for all builtins and output their contents in embedded.cc. This file is then compiled into the final V8 binary.

The (simplified) V8 embedded build process

The embedded.cc file itself contains both metadata and generated builtins machine code as a series of .byte directives that instruct the C++ compiler (in our case, clang or gcc) to place the specified byte sequence directly into the output object file (and later the executable).

// Information about embedded builtins are included in
// a metadata table.
V8_EMBEDDED_TEXT_HEADER(v8_Default_embedded_blob_)
__asm__(".byte 0x65,0x6d,0xcd,0x37,0xa8,0x1b,0x25,0x7e\n"
[snip metadata]

// Followed by the generated machine code.
__asm__(V8_ASM_LABEL("Builtins_RecordWrite"));
__asm__(".byte 0x55,0x48,0x89,0xe5,0x6a,0x18,0x48,0x83\n"
[snip builtins code]

Contents of the .text section are mapped into read-only executable memory at runtime, and the operating system will share memory across processes as long as it contains only position-independent code without relocatable symbols. This is exactly what we wanted.

But V8’s Code objects consist not only of the instruction stream, but also have various pieces of (sometimes isolate-dependent) metadata. Normal run-of-the-mill Code objects pack both metadata and the instruction stream into a variable-sized Code object that is located on the managed heap.

On-heap Code object layout

As we’ve seen, embedded builtins have their native instruction stream located outside the managed heap, embedded into the .text section. To preserve their metadata, each embedded builtin also has a small associated Code object on the managed heap, called the off-heap trampoline. Metadata is stored on the trampoline as for standard Code objects, while the inlined instruction stream simply contains a short sequence which loads the address of the embedded instructions and jumps there.

Off-heap Code object layout

The trampoline allows V8 to handle all Code objects uniformly. For most purposes, it is irrelevant whether the given Code object refers to standard code on the managed heap or to an embedded builtin.

Optimizing for performance

With the solution described in previous sections, embedded builtins were essentially feature-complete, but benchmarks showed that they came with significant slowdowns. For instance, our initial solution regressed Speedometer 2.0 by more than 5% overall.

We began to hunt for optimization opportunities, and identified major sources of slowdowns. The generated code was slower due to frequent indirections taken to access isolate- and process-dependent objects. Root constants were loaded from the root list (1 indirection), other heap constants from the global builtins constant pool (2 indirections), and external references additionally had to be unpacked from within a heap object (3 indirections). The worst offender was our new calling sequence, which had to load the trampoline Code object, call it, only to then jump to the target address. Finally, it appears that calls between the managed heap and binary-embedded code were inherently slower, possibly due to the long jump distance interfering with the CPU’s branch prediction.

Our work thus concentrated on 1. reducing indirections, and 2. improving the builtin calling sequence. To address the former, we altered the Isolate object layout to turn most object loads into a single root-relative load. The global builtins constant pool still exists, but only contains infrequently-accessed objects.

Optimized Isolate layout

Calling sequences were significantly improved on two fronts. Builtin-to-builtin calls were converted into a single pc-relative call instruction. This was not possible for runtime-generated JIT code since the pc-relative offset could exceed the maximal 32-bit value. There, we inlined the off-heap trampoline into all call sites, reducing the calling sequence from 6 to just 2 instructions.

With these optimizations, we were able to limit regressions on Speedometer 2.0 to roughly 0.5%.

Results

We evaluated the impact of embedded builtins on x64 over the top 10k most popular websites, and compared against both lazy- and eager deserialization (described above).

V8 heap size reduction vs. eager and lazy deserialization

Whereas previously Chrome would ship with a memory-mapped snapshot that we’d deserialize on each Isolate, now the snapshot is replaced by embedded builtins that are still memory mapped but do not need to be deserialized. The cost for builtins used to be c*(1 + n) where n is the number of Isolates and c the memory cost of all builtins, whereas now it’s just c * 1 (in practice, a small amount of per-Isolate overhead also remains for off heap trampolines).

Compared against eager deserialization, we reduced the median V8 heap size by 19%. The median Chrome renderer process size per site has decreased by 4%. In absolute numbers, the 50th percentile saves 1.9 MB, the 30th percentile saves 3.4 MB, and the 10th percentile saves 6.5 MB per site.

Significant additional memory savings are expected once bytecode handlers are also binary-embedded.

Embedded builtins are rolling out on x64 in Chrome 69, and mobile platforms will follow in Chrome 70. Support for ia32 is expected to be released in late 2018.

Note: All diagrams were generated using Vyacheslav Egorov’s awesome Shaky Diagramming tool.

Posted by Jakob Gruber (@schuay)

Liftoff: a new baseline compiler for WebAssembly in V8

$
0
0

V8 v6.9 includes Liftoff, a new baseline compiler for WebAssembly. Liftoff is now enabled by default on desktop systems. This article details the motivation to add another compilation tier and describes the implementation and performance of Liftoff.

Since WebAssembly launched more than a year ago, adoption on the web has been steadily increasing. Big applications targeting WebAssembly have started to appear. For example, Epic’s ZenGarden benchmark comprises a 39.5 MB WebAssembly binary, and AutoDesk ships as a 36.8 MB binary. Since compilation time is essentially linear in the binary size, these applications take a considerable time to start up. On many machines it’s more than 30 seconds, which does not provide a great user experience.

But why does it take this long to start up a WebAssembly app, if similar JS apps start up much faster? The reason is that WebAssembly promises to deliver predictable performance, so once the app is running, you can be sure to consistently meet your performance goals (e.g. rendering 60 frames per second, no audio lag or artifacts…). In order to achieve this, WebAssembly code is compiled ahead of time in V8, to avoid any compilation pause introduced by a just-in-time compiler that could result in visible jank in the app.

The existing compilation pipeline (TurboFan)

V8’s approach to compiling WebAssembly has relied on TurboFan, the optimizing compiler we designed for JavaScript and asm.js. TurboFan is a powerful compiler with a graph-based intermediate representation (IR) suitable for advanced optimizations such as strength reduction, inlining, code motion, instruction combining, and sophisticated register allocation. TurboFan’s design supports entering the pipeline very late, nearer to machine code, which bypasses many of the stages necessary for supporting JavaScript compilation. By design, transforming WebAssembly code into TurboFan’s IR (including SSA-construction) in a straightforward single pass is very efficient, partially due to WebAssembly’s structured control flow. Yet the backend of the compilation process still consumes considerable time and memory.

The new compilation pipeline (Liftoff)

The goal of Liftoff is to reduce startup time for WebAssembly-based apps by generating code as fast as possible. Code quality is secondary, as hot code will eventually be recompiled with Turbofan anyway.. Liftoff avoids the time and memory overhead of constructing an IR and generates machine code in a single pass over the bytecode of a WebAssembly function.

Pipeline

From the diagram above it is obvious that Liftoff should be able to generate code much faster than TurboFan since the pipeline only consists of two stages. In fact, the function body decoder does a single pass over the raw WebAssembly bytes and interacts with the subsequent stage via callbacks, so code generation is performed while decoding and validating the function body. Together with WebAssembly’s streaming APIs, this allows V8 to compile WebAssembly code to machine code while downloading over the network.

Code generation in Liftoff

Liftoff is a simple code generator, and fast. It performs only one pass over the opcodes of a function, generating code for each opcode, one at a time. For simple opcodes like arithmetics, this is often a single machine instruction, but can be more for others like calls. Liftoff maintains metadata about the operand stack in order to know where the inputs of each operation are currently stored. This virtual stack exists only during compilation. WebAssembly’s structured control flow and validation rules guarantee that the location of these inputs can be statically determined. Thus an actual runtime stack onto which operands are pushed and popped is not necessary. During execution, each value on the virtual stack will either be held in a register or be spilled to the physical stack frame of that function. For small integer constants (generated by i32.const), Liftoff only records the constant’s value in the virtual stack and does not generate any code. Only when the constant is used by a subsequent operation, it is emitted or combined with the operation, for example by directly emitting a addl <reg>, <const> instruction on x64. This avoids ever loading that constant into a register, resulting in better code.

Let’s go through a very simple function to see how Liftoff generates code for that.

This example function takes two parameters and returns their sum. When Liftoff decodes the bytes of this function, it first begins by initializing its internal state for the local variables according to the calling convention for WebAssembly functions. For x64, V8’s calling convention passes the two parameters in the registers rax and rdx.

For get_local instructions, Liftoff does not generate any code, but instead just updates its internal state to reflect that these register values are now pushed on the virtual stack. The i32.add instruction then pops the two registers and chooses a register for the result value. We cannot use any of the input registers for the result, since both registers still appear on the stack for holding the local variables. Overwriting them would change the value returned by a later get_local instruction. So Liftoff picks a free register, in this case rcx, and produce the sum of rax and rdx into that register. rcx is then pushed onto the virtual stack.

After the i32.add instruction, the function body is finished, so Liftoff must assemble the function return. As our example function has one return value, validation requires that there must be exactly one value on the virtual stack at the end of the function body. So Liftoff generates code that moves the return value held in rcx into the proper return register rax and then returns from the function.

For the sake of simplicity, the example above does not contain any blocks (if, loop…) or branches. Blocks in WebAssembly introduce control merges, since code can branch to any parent block, and if-blocks can be skipped. These merge points can be reached from different stack states. Following code, however, has to assume a specific stack state to generate code. Thus, Liftoff snapshots the current state of the virtual stack as the state which will be assumed for code following the new block (i.e. when returning to the control level where we currently are). The new block will then continue with the currently active state, potentially changing where stack values or locals are stored: some might be spilled to the stack or held in other registers. When branching to another block or ending a block (which is the same as branching to the parent block), Liftoff must generate code that adapts the current state to the expected state at that point, such that the code emitted for the target we branch to finds the right values where it expects them. Validation guarantees that the height of the current virtual stack matches the height of the expected state, so Liftoff need only generate code to shuffle values between registers and/or the physical stack frame as shown below.

Let’s look at an example of that.

The example above assumes a virtual stack with two values on the operand stack. Before starting the new block, the top value on the virtual stack is popped as argument to the if instruction. The remaining stack value needs to be put in another register, since it is currently shadowing the first parameter, but when branching back to this state we might need to hold two different values for the stack value and the parameter. In this case Liftoff chooses to deduplicate it into the rcx register. This state is then snapshotted, and the active state is modified within the block. At the end of the block, we implicitly branch back to the parent block, so we merge the current state into the snapshot by moving register rbx into rcx and reloading register rdx from the stack frame.

Tiering up from Liftoff to TurboFan

With Liftoff and Turbofan, V8 now has two compilation tiers for WebAssembly: Liftoff as the baseline compiler for fast startup and TurboFan as optimizing compiler for maximum performance. This poses the question of how to combine the two compilers to provide the best overall user experience.

For JavaScript, V8 uses the Ignition interpreter and the TurboFan compiler and employs a dynamic tier-up strategy. Each function is first executed in Ignition, and if the function becomes hot, TurboFan compiles it into highly-optimized machine code. A similar approach could also be used for Liftoff, but the tradeoffs are a bit different here:

  1. WebAssembly does not require type feedback to generate fast code. Where JavaScript greatly benefits from gathering type feedback, WebAssembly is statically typed, so the engine can generate optimized code right away.
  2. WebAssembly code should run predictably fast, without a lengthy warm-up phase. One of the reasons applications target WebAssembly is to execute on the web with predictable high performance. So we can neither tolerate running suboptimal code for too long, nor do we accept compilation pauses during execution.
  3. An important design goal of the Ignition interpreter for JavaScript is to reduce memory usage by not compiling functions at all. Yet we found that an interpreter for WebAssembly is far too slow to deliver on the goal of predictably fast performance. We did, in fact, build such an interpreter, but being 20× or more slower than compiled code, it is only useful for debugging, regardless of how much memory it saves. Given this, the engine must store compiled code anyway; in the end it should store only the most compact and most efficient code, which is TurboFan optimized code.

From these constraints we concluded that dynamic tier-up is not the right tradeoff for V8’s implementation of WebAssembly right now, since it would increase code size and reduce performance for an indeterminate time span. Instead, we chose a strategy of eager tier-up. Immediately after Liftoff compilation of a module finished, the WebAssembly engine starts background threads to generate optimized code for the module. This allows V8 to start executing code quickly (after Liftoff finished), but still have the most performant TurboFan code available as early as possible.

The picture below shows the trace of compiling and executing the EpicZenGarden benchmark. It shows that right after Liftoff compilation we can instantiate the WebAssembly module and start executing it. TurboFan compilation still takes several more seconds, so during that tier-up period the observed execution performance will gradually increase since individual TurboFan functions will be used as soon as they are finished.

Performance

Two metrics are interesting for evaluating the performance of the new Liftoff compiler. First we want to compare the compilation speed (i.e. time to generate code) with TurboFan. Second, we want to measure the performance of the generated code (i.e. execution speed). The first measure is the more interesting here, since the goal of Liftoff is to reduce startup time by generating code as quickly as possible. On the other hand, the performance of the generated code should still be pretty good since that code might still execute for several seconds or even minutes on low-end hardware.

Performance of generating code

For measuring the compiler performance itself, we ran a number of benchmarks and measured the raw compilation time using tracing (see picture above). We run both benchmarks on an HP Z840 machine (2 x Intel Xeon E5-2690 @2.6GHz, 24 cores, 48 threads) and on a Macbook Pro (Intel Core i7-4980HQ @2.8GHz, 4 cores, 8 threads). Note that Chrome does currently not use more than 10 background threads, so most of the cores of the Z840 machine are unused.

We execute three benchmarks:

  1. EpicZenGarden: The ZenGarden demo running on the Epic framework: https://s3.amazonaws.com/mozilla-games/ZenGarden/EpicZenGarden.html
  2. Tanks!: A demo of the Unity engine: https://webassembly.org/demo/
  3. AutoDesk: https://web.autocad.com/
  4. PSPDFKit: https://pspdfkit.com/webassembly-benchmark/

For each benchmark, we measure the raw compilation time using the tracing output as shown above. This number is more stable than any time reported by the benchmark itself, as it does not rely on a task being scheduled on the main thread and does not include unrelated work like creating the actual WebAssembly instance.

The graphs below show the results of these benchmarks. Each benchmark was executed three times, and we report the average compilation time.

Code Generation Performance: Liftoff vs. TurboFan on Macbook

Code Generation Performance: Liftoff vs. TurboFan on Z840

As expected, the Liftoff compiler generates code much faster both on the high-end desktop workstation as well as on the MacBook. The speedup of Liftoff over TurboFan is even bigger on the less-capable MacBook hardware.

Performance of the generated code

Even though performance of the generated code is a secondary goal, we want to preserve user experience with high performance in the startup phase, as Liftoff code might execute for several seconds before TurboFan code is finished.

For measuring Liftoff code performance, we turned off tier-up in order to measure pure Liftoff execution. In this setup, we execute two benchmarks:

  1. Unity headless benchmarks

    This is a number of benchmarks running in the Unity framework. They are headless, hence can be executed in the d8 shell directly. Each benchmark reports a score, which is not necessarily proportional to the execution performance, but good enough to compare the performance.

  2. PSPDFKit: https://pspdfkit.com/webassembly-benchmark/

    This benchmark reports the time it takes to perform different actions on a pdf document and the time it takes to instantiate the WebAssembly module (including compilation).

Just as before, we execute each benchmark three times and use the average of the three runs. Since the scale of the recorded numbers differs significantly between the benchmarks, we report the relative performance of Liftoff vs TurboFan. A value of +30% means that Liftoff code runs 30% slower than TurboFan. Negative numbers indicate that Liftoff executes faster. Here are the results:

Liftoff Performance on Unity

On Unity, Liftoff code execute on average around 50% slower than TurboFan code on the desktop machine and 70% slower on the MacBook. Interestingly, there is one case (Mandelbrot Script) where Liftoff code outperforms TurboFan code. This is likely an outlier where, for example, the register allocator of TurboFan is doing poorly in a hot loop. We are investigating to see if TurboFan can be improved to handle this case better.

Liftoff Performance on PSPDFKit

On the PSPDFKit benchmark, Liftoff code executes 18-54% slower than optimized code, while initialization improves significantly, as expected. These numbers show that for real-world code which also interacts with the browser via JavaScript calls, the performance loss of unoptimized code is generally lower than on more computation-intensive benchmarks.

And again, note that for these numbers we turned off tier-up completely, so we only ever executed Liftoff code. In production configurations, Liftoff code will gradually be replaced by TurboFan code, such that the lower performance of Liftoff code lasts only for short period of time.

Future work

After the initial launch of Liftoff, we are working to further improve startup time, reduce memory usage, and bring the benefits of Liftoff to more users. In particular, we are working on improving the following things:

  1. Port Liftoff to arm and arm64 to also use it on mobile devices.Currently, Liftoff is only implemented for Intel platforms (32 and 64 bit), which mostly captures desktop use cases. In order to also reach mobile users, we will port Liftoff to more architectures.
  2. Implement dynamic tier-up for mobile devices.Since mobile devices tend to have much less memory available than desktop systems, we need to adapt our tiering strategy for these devices. Just recompiling all functions with TurboFan easily doubles the memory needed to hold all code, at least temporarily (until Liftoff code is discarded). Instead, we are experimenting with a combination of lazy compilation with Liftoff and dynamic tier-up of hot functions in TurboFan.
  3. Improve performance of Liftoff code generation.The first iteration of an implementation is rarely the best one. There are several things which can be tuned to speed up the compilation speed of Liftoff even more. This will gradually happen over the next releases.
  4. Improve performance of Liftoff code.Apart from the compiler itself, the size and speed of the generated code can also be improved. This will also happen gradually over the next releases.

Conclusion

V8 now contains Liftoff, a new baseline compiler for WebAssembly. Liftoff vastly reduces start-up time of WebAssembly applications with a simple and fast code generator. On desktop systems, V8 still reaches maximum peak performance by recompiling all code in the background using TurboFan. Liftoff is enabled by default in V8 v6.9 (Chrome 69), and can be controlled explicitly with the --liftoff/--no-liftoff and chrome://flags/#enable-webassembly-baseline flags in each, respectively.

Posted by Clemens Hammacher, WebAssembly compilation maestro

Celebrating 10 years of V8

$
0
0

This month marks the 10-year anniversary of shipping not just Google Chrome, but also the V8 project. This post gives an overview of major milestones for the V8 project in the past 10 years as well as the years before, when the project was still secret.

A visualization of the V8 code base over time, created using gource.

Before V8 shipped: the early years

Google hired Lars Bak in the autumn of 2006 to build a new JavaScript engine for the Chrome web browser, which at the time was still a secret internal Google project. Lars had recently moved back to Aarhus, Denmark, from Silicon Valley. Since there was no Google office there and Lars wanted to remain in Denmark, Lars and several of the project’s original engineers began working on the project in an outbuilding on his farm. The new JavaScript runtime was christened “V8”, a playful reference to the powerful engine you can find in a classic muscle car. Later, when the V8 team had grown, the developers moved from their modest quarters to a modern office building in Aarhus, but the team took with them their singular drive and focus on building the fastest JavaScript runtime on the planet.

Launching and evolving V8

V8 went open-source the same day Chrome was launched: on September 2nd, 2008. The initial commit dates back to June 30th, 2008. Prior to that date, V8 development happened in a private CVS repository. Initially, V8 supported only the ia32 and ARM instruction sets and used SCons as its build system.

2009 saw the introduction of a brand new regular expression engine named Irregexp, resulting in performance improvements for real-world regular expressions. With the introduction of an x64 port, the number of supported instruction sets increased from two to three. 2009 also marked the first release of the Node.js project, which embeds V8. The possibility for non-browser projects to embed V8 was explicitly mentioned in the original Chrome comic. With Node.js, it actually happened! Node.js grew to be one of the most popular JavaScript ecosystems.

2010 witnessed a big boost in runtime performance as V8 introduced a brand-new optimizing JIT compiler. Crankshaft generated machine code that was twice as fast and 30% smaller than the previous (unnamed) V8 compiler. That same year, V8 added its fourth instruction set: 32-bit MIPS.

2011 came, and garbage collection was vastly improved. A new incremental garbage collector drastically reduced pause times while maintaining great peak performance and low memory usage. V8 introduced the concept of Isolates, which allows embedders to spin up multiple instances of the V8 runtime in a process, paving the way for lighter-weight Web Workers in Chrome. The first of V8’s two build system migrations occurred as we transitioned from SCons to GYP. We implemented support for ES5 strict mode. Meanwhile, development moved from Aarhus to Munich (Germany) under new leadership with lots of cross-pollination from the original team in Aarhus.

2012 was a year of benchmarks for the V8 project. The team did speed sprints to optimize V8’s performance as measured through the Sunspider and Kraken benchmark suites. Later, we developed a new benchmark suite named Octane (with V8 Bench at its core) that brought peak performance competition to the forefront and spurred massive improvements in runtime and JIT technology in all major JS engines. One outcome of these efforts was the switch from randomized sampling to a deterministic, count-based technique for detecting “hot” functions in V8’s runtime profiler. This made it significantly less likely that some page loads (or benchmark runs) would randomly be much slower than others.

2013 witnessed the appearance of a low-level subset of JavaScript named asm.js. Since asm.js is limited to statically-typed arithmetic, function calls, and heap accesses with primitive types only, validated asm.js code could run with predictable performance. We released a new version of Octane, Octane 2.0 with updates to existing benchmarks as well as new benchmarks that target use cases like asm.js. Octane spurred the development of new compiler optimizations like allocation folding and allocation-site-based optimizations for type transitioning and pretenuring that vastly improved peak performance. As part of an effort we internally nicknamed “Handlepocalypse”, the V8 Handle API was completely rewritten to make it easier to use correctly and safely. Also in 2013, Chrome’s implementation of TypedArrays in JavaScript was moved from Blink to V8.

In 2014, V8 moved some of the work of JIT compilation off the main thread with concurrent compilation, reducing jank and significantly improving performance. Later that year, we landed the initial version of a new optimizing compiler named TurboFan. Meanwhile, our partners helped port V8 to three new instruction set architectures: PPC, MIPS64, and ARM64. Following Chromium, V8 transitioned to yet another build system, GN. The V8 testing infrastructure saw significant improvements, with a Tryserver now available to test each patch on various build bots before landing. For source control, V8 migrated from SVN to Git.

2015 was a busy year for V8 on a number of fronts. We implemented code caching and script streaming, significantly speeding up web page load times. Work on our runtime system’s use of allocation mementos was published in ISMM 2015. Later that year, we kicked off the work on a new interpreter named Ignition. We experimented with the idea of subsetting JavaScript with strong mode to achieve stronger guarantees and more predictable performance. We implemented strong mode behind a flag, but later found its benefits did not justify the costs. The addition of a commit queue made big improvements in productivity and stability. V8’s garbage collector also began cooperating with embedders such as Blink to schedule garbage collection work during idle periods. Idle-time garbage collection significantly reduced observable garbage collection jank and memory consumption. In December, the first WebAssembly prototype landed in V8.

In 2016, we shipped the last pieces of the ES2015 (previously known as “ES6”) feature set (including promises, class syntax, lexical scoping, destructuring, and more), as well as some ES2016 features. We also started rolling out the new Ignition and TurboFan pipeline, using it to compile and optimize ES2015 and ES2016 features, and shipping Ignition by default for low-end Android devices. Our successful work on idle-time garbage collection was presented at PLDI 2016. We kicked off the Orinoco project, a new mostly-parallel and concurrent garbage collector for V8 to reduce main thread garbage collection time. In a major refocus, we shifted our performance efforts away from synthetic micro-benchmarks and instead began to seriously measure and optimize real-world performance. For debugging, the V8 inspector was migrated from Chromium to V8, allowing any V8 embedder (and not just Chromium) to use the Chrome DevTools to debug JavaScript running in V8. The WebAssembly prototype graduated from prototype to experimental support, in coordination with other browser vendors experimental support for WebAssembly. V8 received the ACM SIGPLAN Programming Languages Software Award. And another port was added: S390.

In 2017, we finally completed our multi-year overhaul of the engine, enabling the new Ignition and TurboFan pipeline by default. This made it possible to later remove Crankshaft (130,380 deleted lines of code) and Full-codegen from the codebase. We launched Orinoco v1.0, including concurrent marking, concurrent sweeping, parallel scavenging, and parallel compaction. We officially recognized Node.js as a first-class V8 embedder alongside Chromium. Since then, it’s impossible for a V8 patch to land if doing so breaks the Node.js test suite. Our infrastructure gained support for correctness fuzzing, ensuring that any piece of code produces consistent results regardless of the configuration it runs in.

In an industry-wide coordinated launch, V8 shipped WebAssembly on-by-default. We implemented support for JavaScript modules as well as the full ES2017 and ES2018 feature sets (including async functions, shared memory, async iteration, rest/spread properties, and RegExp features). We shipped native support for JavaScript code coverage, and launched the Web Tooling Benchmark to help us measure how V8’s optimizations impact performance for real-world developer tools and the JavaScript output they generate. Wrapper tracing from JavaScript objects to C++ DOM objects and back allowed us to resolve long-standing memory leaks in Chrome and to handle the transitive closure of objects over the JavaScript and Blink heap efficiently. We later used this infrastructure to increase the capabilities of the heap snapshotting developer tool.

2018 saw an industry-wide security event upend what we thought we knew about CPU information security with the public disclosure of the Spectre/Meltdown vulnerabilities. V8 engineers performed extensive offensive research to help understand the threat for managed languages and develop mitigations. V8 shipped mitigations against Spectre and similar side-channel attacks for embedders that run untrusted code.

Recently, we shipped a baseline compiler for WebAssembly named Liftoff which greatly reduces startup time for WebAssembly applications while still achieving predictable performance. We shipped BigInt, a new JavaScript primitive that enables arbitrary-precision integers. We implemented embedded builtins, and made it possible to lazily deserialize them, significantly reducing V8’s footprint for multiple Isolates. We made it possible to compile script bytecode on a background thread. We started the Unified V8-Blink Heap project to run a cross-component V8 and Blink garbage collection in sync. And the year’s not over yet…

Performance ups and downs

Chrome’s V8 Bench score over the years shows the performance impact of V8’s changes. (We’re using the V8 Bench because it’s one of the few benchmarks that can still run in the original Chrome beta.)

Chrome’s V8 Bench score from 2008 to 2018

Our score on this benchmark went up over the last ten years!

However, you might notice two performance dips over the years. Both are interesting because they correspond to significant events in V8’s history. The performance drop in 2015 happened when V8 shipped baseline versions of ES2015 features. These features were cross-cutting in the V8 code base, and we therefore focused on correctness rather than performance for their initial release. We accepted these slight speed regressions to get features to developers as quickly as possible. In early 2018, the Spectre vulnerability was disclosed, and V8 shipped mitigations to protect users against potential exploits, resulting in another regression in performance. Luckily, now that Chrome is shipping Site Isolation, we can disable the mitigations again, bringing performance back on par.

Another take-away from this chart is that it starts to level off around 2013. Does that mean V8 gave up and stopped investing in performance? Quite the opposite! The flattening of the graphs represents the V8 team’s pivot from synthetic micro-benchmarks (such as V8 Bench and Octane) to optimizing for real-world performance. V8 Bench is an old benchmark that doesn’t use any modern JavaScript features, nor does it approximate actual real-world production code. Contrast this with the more recent Speedometer benchmark suite:

Chrome’s Speedometer 1 score from 2013 to 2018

Although V8 Bench shows minimal improvements from 2013 to 2018, our Speedometer 1 score went up (another) during this same time period. (We used Speedometer 1 because Speedometer 2 uses modern JavaScript features that weren’t yet supported in 2013.)

Nowadays, we have even betterbenchmarks that more accurately reflect modern JavaScript apps, and on top of that, we actively measure and optimize for existing web apps.

Summary

Although V8 was originally built for Google Chrome, it has always been a stand-alone project with a separate codebase and an embedding API that allows any program to use its JavaScript execution services. Over the last 10 years, the open nature of the project has helped it become a key technology not only for the Web Platform, but in other contexts, like Node.js. Along the way the project evolved and remain relevant despite many changes and dramatic growth.

Initially, V8 supported only two instruction sets. In the last 10 years the list of supported platforms reached eight: ia32, x64, ARM, ARM64, 32- and 64-bit MIPS, 64-bit PPC, and S390. V8’s build system migrated from SCons to GYP to GN. The project moved from Denmark to Germany, and now has engineers all over the world, including in London, Mountain View, and San Francisco, with contributors outside of Google from many more places. We’ve transformed our entire JavaScript compilation pipeline from unnamed components to Full-codegen (a baseline compiler) and Crankshaft (an feedback-driven optimizing compiler) to Ignition (an interpreter) and TurboFan (a better feedback-driven optimizing compiler). V8 went from being “just” a JavaScript engine to also supporting WebAssembly. The JavaScript language itself evolved from ECMAScript 3 to ES2018; the latest V8 even implements post-ES2018 features.

The story arc of Web is a long and enduring one. Celebrating Chrome and V8’s 10th birthday is a good opportunity to reflect that even though this is a big milestone, the Web Platform’s narrative has lasted for more than 25 years. We have no doubt the Web’s story will continue for at least that long in the future. We’re committed to making sure that V8, JavaScript, and WebAssembly continue to be interesting characters in that narrative. We’re excited to see what the next decade has in store. Stay tuned!

Improving DataView performance in V8

$
0
0

DataViews are one of the two possible ways to do low-level memory accesses in JavaScript, the other one being TypedArrays. Up until now, DataViews were much less optimized than TypedArrays in V8, resulting in lower performance on tasks such as graphics-intensive workloads or when decoding/encoding binary data. The reasons for this have been mostly historical choices, like the fact that asm.js chose TypedArrays instead of DataViews, and so engines were incentivized to focus on performance of TypedArrays.

Because of the performance penalty, JavaScript developers such as the Google Maps team decided to avoid DataViews and rely on TypedArrays instead, at the cost of increased code complexity. This blog post explains how we brought DataView performance to match — and even surpass — equivalent TypedArray code in V8 v6.9, effectively making DataView usable for performance-critical real-world applications.

Background

Since the introduction of ES2015, JavaScript has supported reading and writing data in raw binary buffers called ArrayBuffers. ArrayBuffers cannot be directly accessed; rather, programs must use a so-called array buffer view object that can be either a DataView or a TypedArray.

TypedArrays allow programs to access the buffer as an array of uniformly typed values, such as an Int16Array or a Float32Array.

const buffer = newArrayBuffer(32);
const array = newInt16Array(buffer);

for (let i = 0; i < array.length; i++) {
array[i] = i * i;
}

console.log(array);
// → [0, 1, 4, 9, 16, 25, 36, 49, 64, 81, 100, 121, 144, 169, 196, 225]

On the other hand, DataViews allow for more fine-grained data access. They let the programmer choose the type of values read from and written tothe buffer by providing specialized getters and setters for each number type, making them useful for serializing data structures.

const buffer = newArrayBuffer(32);
const view = newDataView(buffer);

const person = { age: 42, height: 1.76 };

view.setUint8(0, person.age);
view.setFloat64(1, person.height);

console.log(view.getUint8(0)); // Expected output: 42
console.log(view.getFloat64(1)); // Expected output: 1.76

Moreover, DataViews also allow the choice of the endianness of the data storage, which can be useful when receiving data from external sources such as the network, a file, or a GPU.

const buffer = newArrayBuffer(32);
const view = newDataView(buffer);

view.setInt32(0, 0x8BADF00D, true); // Little-endian write.
console.log(view.getInt32(0, false)); // Big-endian read.
// Expected output: 0x0DF0AD8B (233876875)

An efficient DataView implementation has been a feature request for a long time (see this bug report from over 5 years ago), and we are happy to announce that DataView performance is now on par!

Legacy runtime implementation

Until recently, the DataView methods used to be implemented as built-in C++ runtime functions in V8. This is very costly, because each call would require an expensive transition from JavaScript to C++ (and back).

In order to investigate the actual performance cost incurred by this implementation, we set up a performance benchmark that compares the native DataView getter implementation with a JavaScript wrapper simulating DataView behavior. This wrapper uses an Uint8Array to read data byte by byte from the underlying buffer, and then computes the return value from those bytes. Here is, for example, the function for reading little-endian 32-bit unsigned integer values:

functionLittleEndian(buffer) { // Simulate little-endian DataView reads.
this.uint8View_ = newUint8Array(buffer);
}

LittleEndian.prototype.getUint32 = function(byteOffset) {
returnthis.uint8View_[byteOffset] |
(this.uint8View_[byteOffset + 1] << 8) |
(this.uint8View_[byteOffset + 2] << 16) |
(this.uint8View_[byteOffset + 3] << 24);
};

TypedArrays are already heavily optimized in V8, so they represent the performance goal that we wanted to match.

Original DataView performance

Our benchmark shows that native DataView getter performance was as much as 4 times slower than the Uint8Array based wrapper, for both big-endian and little-endian reads.

Improving baseline performance

Our first step in improving the performance of DataView objects was to move the implementation from the C++ runtime to CodeStubAssembler (also known as CSA). CSA is a portable assembly language that allows us to write code directly in TurboFan’s machine-level intermediate representation (IR), and we use it to implement optimized parts of V8’s JavaScript standard library. Rewriting code in CSA bypasses the call to C++ completely, and also generates efficient machine code by leveraging TurboFan’s backend.

However, writing CSA code by hand is cumbersome. Control flow in CSA is expressed much like in assembly, using explicit labels and gotos, which makes the code harder to read and understand at a glance.

In order to make it easier for developers to contribute to the optimized JavaScript standard library in V8, and to improve readability and maintainability, we started designing a new language called V8 Torque, that compiles down to CSA. The goal for Torque is to abstract away the low-level details that make CSA code harder to write and maintain, while retaining the same performance profile.

Rewriting the DataView code was an excellent opportunity to start using Torque for new code, and helped provide the Torque developers with a lot of feedback about the language. This is what the DataView’s getUint32() method looks like, written in Torque:

macro LoadDataViewUint32(buffer: JSArrayBuffer, offset: intptr,
requested_little_endian: bool,
signed: constexpr bool): Number {
let data_pointer: RawPtr = buffer.backing_store;

let b0: uint32 = LoadUint8(data_pointer, offset);
let b1: uint32 = LoadUint8(data_pointer, offset + 1);
let b2: uint32 = LoadUint8(data_pointer, offset + 2);
let b3: uint32 = LoadUint8(data_pointer, offset + 3);
let result: uint32;

if (requested_little_endian) {
result = (b3 << 24) | (b2 << 16) | (b1 << 8) | b0;
} else {
result = (b0 << 24) | (b1 << 16) | (b2 << 8) | b3;
}

return convert<Number>(result);
}

Moving the DataView methods to Torque already showed a 3× improvement in performance, but did not quite match Uint8Array based wrapper performance yet.

Torque DataView performance

Optimizing for TurboFan

When JavaScript code gets hot, we compile it using our TurboFan optimizing compiler, in order to generate highly-optimized machine code that runs more efficiently than interpreted bytecode.

TurboFan works by translating the incoming JavaScript code into an internal graph representation (more precisely, a “sea of nodes”). It starts with high-level nodes that match the JavaScript operations and semantics, and gradually refines them into lower and lower level nodes, until it finally generates machine code.

In particular, a function call, such as calling one of the DataView methods, is internally represented as a JSCall node, which eventually boils down to an actual function call in the generated machine code.

However, TurboFan allows us to check whether the JSCall node is actually a call to a known function, for example one of the builtin functions, and inline this node in the IR. This means that the complicated JSCall gets replaced at compile-time by a subgraph that represents the function. This allows TurboFan to optimize the inside of the function in subsequent passes as part of a broader context, instead of on its own, and most importantly to get rid of the costly function call.

Initial TurboFan DataView performance

Implementing TurboFan inlining finally allowed us to match, and even exceed, the performance of our Uint8Array wrapper, and be 8 times as fast as the former C++ implementation.

Further TurboFan optimizations

Looking at the machine code generated by TurboFan after inlining the DataView methods, there was still room for some improvement. The first implementation of those methods tried to follow the standard pretty closely, and threw errors when the spec indicates so (for example, when trying to read or write out of the bounds of the underlying ArrayBuffer).

However, the code that we write in TurboFan is meant to be optimized to be as fast as possible for the common, hot cases — it doesn’t need to support every possible edge case. By removing all the intricate handling of those errors, and just deoptimizing back to the baseline Torque implementation when we need to throw, we were able to reduce the size of the generated code by around 35%, generating a quite noticeable speedup, as well as considerably simpler TurboFan code.

Following up on this idea of being as specialized as possible in TurboFan, we also removed support for indices or offsets that are too large (outside of Smi range) inside the TurboFan-optimized code. This allowed us to get rid of handling of the float64 arithmetic that is needed for offsets that do not fit into a 32-bit value, and to avoid storing large integers on the heap.

Compared to the initial TurboFan implementation, this more than doubled the DataView benchmark score. DataViews are now up to 3 times as fast as the Uint8Array wrapper, and around 16 times as fast as our original DataView implementation!

Final TurboFan DataView performance

Impact

We’ve evaluated the performance impact of the new implementation on some real-world examples, on top of our own benchmark.

DataViews are often used when decoding data encoded in binary formats from JavaScript. One such binary format is FBX, a format that is used for exchanging 3D animations. We’ve instrumented the FBX loader of the popular three.js JavaScript 3D library, and measured a 10% (around 80 ms) reduction in its execution time.

We compared the overall performance of DataViews against TypedArrays. We found that our new DataView implementation provides almost the same performance as TypedArrays when accessing data aligned in the native endianness (little-endian on Intel processors), bridging much of the performance gap and making DataViews a practical choice in V8.

DataView vs. TypedArray peak performance

We hope that you’re now able to start using DataViews where it makes sense, instead of relying on TypedArray shims. Please send us feedback on your DataView uses! You can reach us via our bug tracker, via mail to v8-users@googlegroups.com, or via @v8js on Twitter.

Posted by Théotime Grohens, le savant de Data-Vue, and Benedikt Meurer (@bmeurer), professional performance pal

Viewing all 74 articles
Browse latest View live